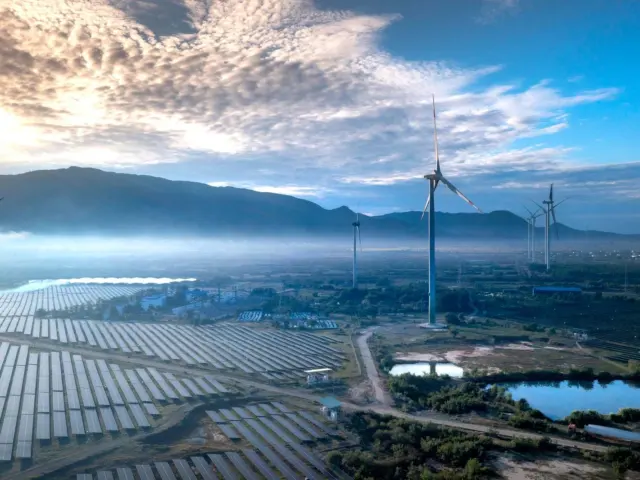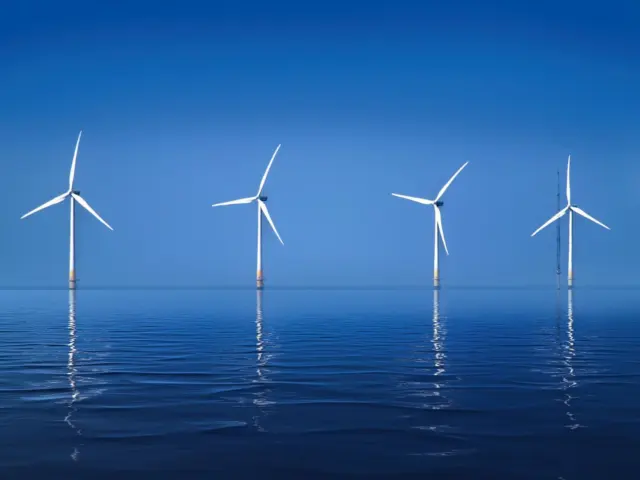
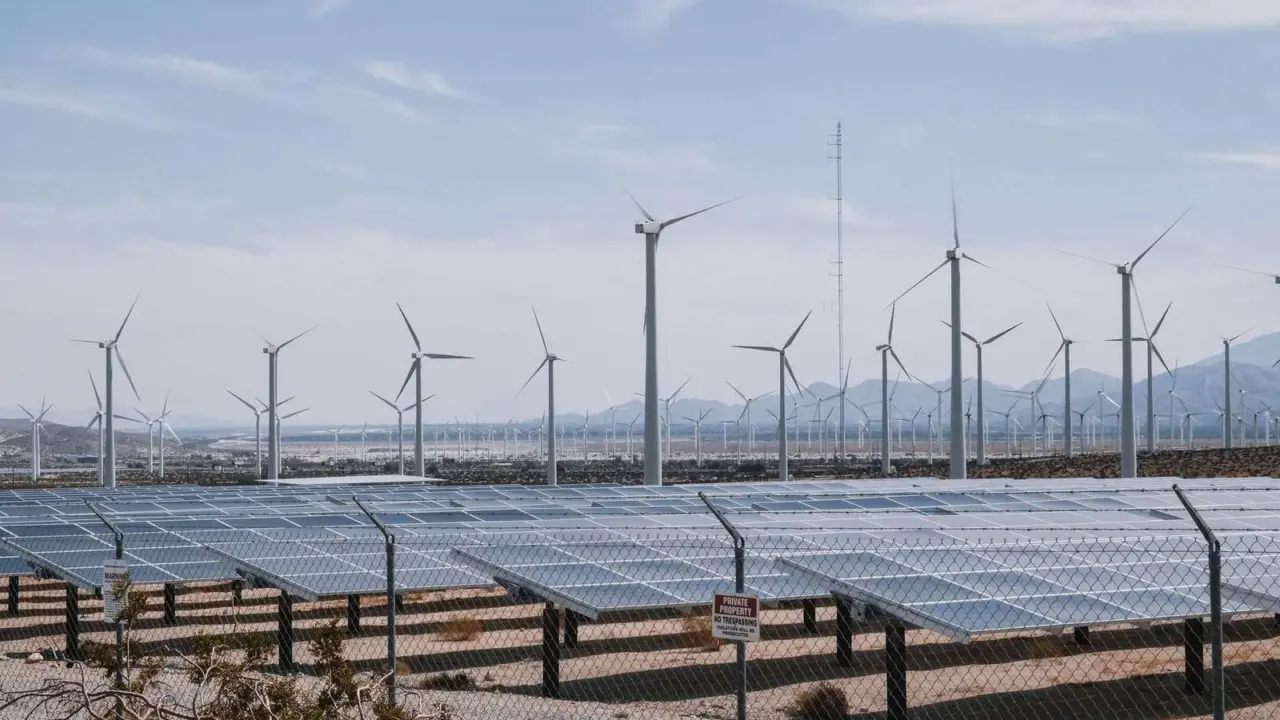
Solar vs wind energy comes down to when and where each resource delivers: in the United States in 2025, utility-scale solar PV ran at a 24.0% capacity factor and wind at 33.8%, and each peaks in a different season.
This comparison is one part of the wider overview of renewable energy sources, and it looks at output, land footprint and variability rather than picking a winner.
How much electricity each one supplies
Wind and solar have grown from a rounding error into major sources of grid power. The U.S. Energy Information Administration (EIA) reports that wind power and utility-scale solar power reached 17% of U.S. generation in 2025, compared with less than 1% in 2005. In that same year wind generated 464,000 GWh and utility-scale solar generated 296,000 GWh. Adding small-scale solar, such as rooftop systems, lifts the combined share of wind and solar to 19% of total net generation.
Globally the order is the same, although the gap is narrowing. Ember’s Global Electricity Review 2025 puts wind at a record 2,494 TWh in 2024, an 8.1% share of world electricity, with solar at a record 2,131 TWh and a 6.9% share.
| Measure | Solar | Wind |
|---|---|---|
| U.S. generation, 2025 (utility-scale) | 296,000 GWh | 464,000 GWh |
| U.S. capacity factor, 2025 | 24.0% | 33.8% |
| World generation, 2024 | 2,131 TWh | 2,494 TWh |
| World share of electricity, 2024 | 6.9% | 8.1% |
The figures above come from the EIA’s Today in Energy analysis of 2025 generation, its Electric Power Monthly capacity-factor table and Ember’s global review.
Capacity factor: output relative to what is installed
Raw generation totals say little about how hard each installed megawatt works. For that, analysts use the capacity factor, which the EIA defines as a comparison of net generation with available capacity.
On that measure, U.S. wind had a higher annual capacity factor than solar PV in 2025, 33.8% against 24.0%. A solar panel can produce only while the sun is up, and the EIA notes that the amount of available sunlight depends on the time of day, location, season, and weather conditions. Wind turbines are not tied to daylight and can produce at any hour when the wind is blowing.
A lower capacity factor does not make solar the weaker option. It means a solar developer has to install more nameplate capacity to deliver the same annual energy, and the economics of that trade-off are what cost metrics such as the levelized cost of energy are designed to capture. The share of installed capacity tells one story, the energy delivered tells another, and a fair comparison needs both.
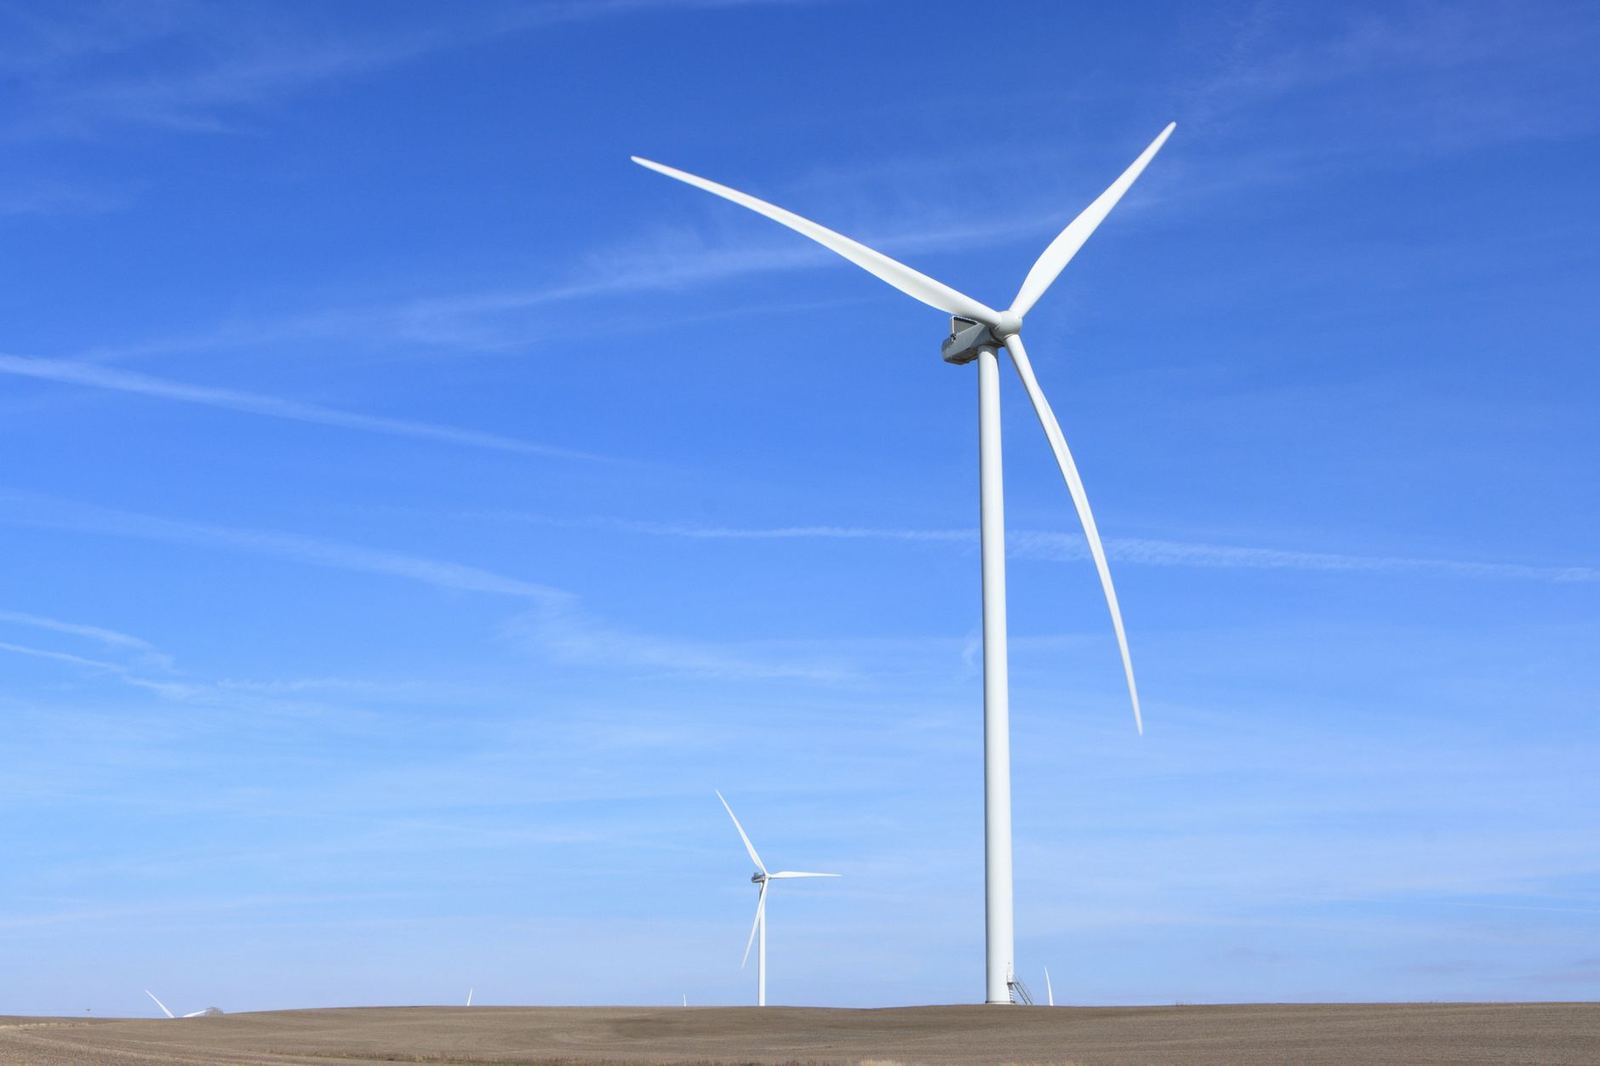
Seasonal and daily variability
Both resources vary, and the monthly EIA data shows how differently. In 2025, U.S. solar PV’s monthly capacity factor ranged from 13.1% in December to 31.9% in June. Wind peaked in a different season, with a monthly capacity factor of 43.1% in March and 23.1% in September.
The pattern is regional as well as seasonal. The EIA describes how, in Tehachapi, California, the wind blows more frequently from April through October than it does in the winter months, and the wind is usually strongest in the afternoon. In Montana, by contrast, strong winter winds channelled through Rocky Mountain valleys create more intense winds during the winter. The same EIA page notes that the seasonal variation in both states matches local electricity demand, which is a reminder that the value of a kilowatt-hour depends on when it arrives, not only on how many arrive.
The EIA classes both technologies as intermittent, meaning they only produce electricity when the resource (wind or sun) is available. Dispatchable plants, such as gas, coal and nuclear, accounted for 75% of U.S. utility-scale generation in 2025, so the grid still leans on sources that can be turned up on demand. Because the two peak in different months in the data above, a grid with both has more than one pattern to draw on. Closing the remaining gaps is the job of storage, transmission and flexible plants, and the role of battery energy storage in that mix is covered in its own guide.
Land use and environmental footprint
Land comparisons are easy to get wrong because the two technologies are measured differently. The National Renewable Energy Laboratory (NREL) studied solar plants in 2013 and reported that a large fixed tilt photovoltaic plant that generates 1 gigawatt-hour per year requires, on average, 2.8 acres for the solar panels. By NREL’s arithmetic, a solar power plant that provides all of the electricity for 1,000 homes would require 32 acres of land.
For wind, NREL’s 2009 survey of large plants (greater than 20 MW, built after 2000) used two classes of land use: direct impact, meaning disturbed land due to physical infrastructure development, and total area, meaning land associated with the complete wind plant project. The average permanent direct impact was 0.3 hectares/MW of capacity, while the average total project area was about 34 hectares/MW. The large gap shows why a single “acres per megawatt” figure for wind can mislead: most of a wind farm’s area is the spacing between turbines, not ground that has been built on.
The two NREL studies use different units and different years, so their numbers should not be divided into each other. What can be said is that a solar plant covers its footprint with panels, while a wind plant spreads a small built footprint across a much larger leased area. Each has its own environmental issues. For solar, clearing land for a power plant can affect the habitats of native plants and animals. For wind, the U.S. Department of Energy notes that wind plants can impact local wildlife and that ideal wind sites are often in remote locations, which raises the question of how the power reaches cities.
Siting, grid connection and cost
Where each resource is strong shapes how it is built. The Department of Energy says that installation challenges must be overcome to bring electricity from wind farms to urban areas, and that upgrading the transmission network could reduce the costs of expanding land-based wind energy. Solar, by comparison, can be installed at utility scale or on individual buildings, which is why the EIA tracks small-scale solar as a separate category from utility-scale plants.
Cost comparisons across countries and years change quickly, and they depend on financing, local resource quality and grid conditions. That is why published comparisons use levelized cost metrics and name a year and a region, rather than declaring one technology cheaper everywhere. The practical outcome of the data above is that neither technology replaces the other: wind and solar each supply a different share of the energy, peak in different months and place different demands on land and wires.
Frequently asked questions
Which has the higher capacity factor, solar or wind?
In the United States in 2025, the EIA’s data shows wind at 33.8% and utility-scale solar PV at 24.0%. Capacity factors vary by country, site and technology, so these are national averages for a single year.
Do solar and wind work well together?
Their output peaks in different seasons in the U.S. data: solar’s monthly capacity factor was highest in June, while wind’s was highest in March. A grid with both has more than one pattern to draw on, though storage and dispatchable plants still fill the remaining gaps.
Are solar and wind intermittent?
Yes. The EIA describes both as intermittent sources that only produce electricity when the sun or wind is available, unlike dispatchable power plants.
Which one needs more land?
It depends on the metric. NREL found large fixed-tilt solar plants need about 2.8 acres per annual gigawatt-hour for the panels, while large wind plants averaged about 34 hectares/MW of total project area but only 0.3 hectares/MW of permanent direct impact. The studies use different units, so they are not a like-for-like ranking.