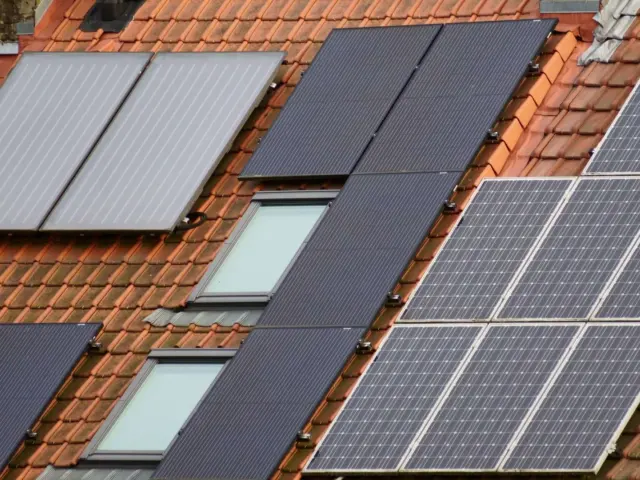

The solar panel payback period is the time a rooftop system takes to recover its cost through lower electricity bills. It is found by dividing the system’s final cost by the money saved each year.
The calculation sits within the wider topic of home energy savings, where a household’s usage, prices and equipment all feed into the answer. What follows covers the formula, the cost and savings inputs, a worked illustration for the United States, and the limits of the method.
How the payback calculation works
The US Department of Energy’s Solar Energy Technologies Office (energy.gov, blog post dated August 1, 2024) quotes a simple rule: divide the final cost, which is the total system cost minus any upfront incentives, by the annual financial benefit, which is the electricity savings plus any annual incentives. The same page lays this out as a sequence of steps.
- Subtract any upfront incentives from the total cost of the system. The result is the net cost.
- Multiply the average monthly electricity bill by 12 to get annual savings, then adjust for any annual incentives.
- Divide the net cost from the first step by the annual savings from the second step. The answer is the payback time in years.
This is a simple payback, a break-even year measured in cash. It does not add interest, tax treatment, rising prices, maintenance or resale value, and it describes a calculation method rather than a prediction for any particular home.
The definition shifts with the way a system is paid for. For a cash purchase, the Department of Energy describes the payback period as the length of time before the system has paid for itself and all future power produced is free. With a loan or a power purchase agreement, the same page says a household may have immediate savings on what it pays for electricity, so the break-even logic looks different.
The cost side: what a system price includes
The numerator of the formula is the installed price. The Department of Energy publishes annual benchmark costs for residential rooftop systems, and the 2025Q1 edition, stated in 2024 US dollars, covers a representative 8 kW dc system. The benchmark costs do not include subsidies payable to the system owner, which reduce the owner’s effective cost.
| Benchmark (United States, 2025Q1, 2024 US dollars) | Lower price basis | Higher price basis | Operating cost |
|---|---|---|---|
| 8 kW dc rooftop PV only | $2.78/W dc | $2.95/W dc | $34/kW dc per year |
| 8 kW dc rooftop PV with 13.5 kWh battery | $4.33/W dc | $4.59/W dc | $64/kW dc per year |
Figures are from the US Department of Energy’s solar photovoltaic system cost benchmarks, which report two price bases for each system type.
The gap between the two rows shows why a battery lengthens a payback calculation: it adds to the numerator, while the bill savings in the denominator come mainly from the panels. Batteries have other uses, such as backup power, that a payback figure does not capture. The Department of Energy also points readers to the Lawrence Berkeley National Laboratory’s Tracking the Sun report for residential installation costs around the country.
Roof conditions, system size and equipment all move the price, so a benchmark is a reference point, not a quote. Site surveys, permits and grid connection are explained in the guide to rooftop solar installation.
The savings side: usage, prices and exports
The denominator depends on how much grid electricity the panels displace and what that electricity would have cost. Two public datasets give a feel for the scale in the United States. The US Energy Information Administration reports that in 2022 the average residential customer purchased 10,791 kilowatthours per year, an average of about 899 kWh per month.
The price per kilowatt-hour matters just as much. According to the EIA’s Electric Power Monthly, the average US residential price was 12.55 cents per kilowatthour in 2016, 16.48 cents in 2024 and 17.23 cents in 2025. Higher prices make each kilowatt-hour that a system produces worth more, and they shorten the calculated payback.

Prices also differ widely by place. In the EIA’s state table for August 2026, the average residential price was 30.48 cents per kilowatthour in Massachusetts and 13.31 cents in North Dakota. The same panels offset a more expensive kilowatt-hour in one state than in the other, so identical systems can have very different break-even years.
Exports are a third input. The Department of Energy notes that solar savings also depend on how much the utility will compensate a household for the excess solar energy it sends back to the grid, and that this differs for every utility. Rules on crediting exports vary by state and by country.
A worked illustration with public figures
The arithmetic below uses the cited US figures only to show the method. It is not a forecast or a statement about any real household. The cost comes from the benchmark: 8 kW dc at the lower price basis of $2.78 per watt dc gives $22,240 before any incentive. The usage is the 2022 national average of 10,791 kWh, priced at the 2025 average of 17.23 cents, which gives $1,859 per year if the system supplied all of it.
| Share of annual use covered by the system | Yearly savings | Simple payback |
|---|---|---|
| 100% | $1,859 | about 12 years |
| 75% | $1,394 | about 16 years |
| 50% | $930 | about 24 years |
Arithmetic from the Department of Energy benchmark and EIA usage figures above; incentives, maintenance and rate changes are left out.
The table shows how sensitive the result is to the share of usage the system actually covers. Real systems rarely line up exactly with a household’s consumption, which is why the Department of Energy’s step-by-step method starts from the household’s own bills and a quoted system cost. Lowering the net cost with incentives, or raising the yearly savings with higher prices, moves every row in the table toward a shorter payback.
What shifts the result
Several inputs move the break-even year without changing the formula.
- Roof and shade. The Department of Energy says panels typically perform best on south-facing roofs with a slope between 15 and 40 degrees, and heavy tree shade may rule rooftop panels out.
- Electricity use. A home with low consumption has less to offset, and a home energy audit can show where electricity goes before a system is sized.
- Incentives. Federal, state and local programs differ by country and change over time, and they alter the net cost in the first step. The Department of Energy names DSIRE as the most comprehensive source of information on incentives and policies in the United States. Only the current rules from an official source should be used in a calculation.
- Financing. Interest on a loan is not part of a simple payback, so a financed system needs its own cash-flow comparison.
- Operating costs. The benchmark table above includes a yearly operating cost per kilowatt of capacity, which a simple payback often ignores.
Reading the result sensibly
A short payback is attractive, but the number needs context. The Department of Energy writes that while payback time is a good indicator of savings potential, a complete picture means comparing solar savings with other low-risk uses of the same money over the time horizon that matters to the household. The same page adds that when the payback time is less than 10 years, most homeowners find solar financially more attractive than any other low-risk investment.
Calculations on this page are explanations of method. They are not personal financial, tax or electrical advice, and a quote from a licensed installer, together with current official incentive rules, is the right basis for a decision about a specific home.
Frequently asked questions
Does a battery change the payback period?
It usually raises the upfront cost. In the Department of Energy’s 2025Q1 benchmark, the 8 kW dc rooftop system with storage costs more per watt than the PV-only system, so the net cost rises while the bill savings come mostly from the panels.
Do incentives shorten the payback?
They shorten it when they reduce the net cost or add to annual benefits, since the formula subtracts upfront incentives from the system cost. Availability depends on the country, state and date, so official sources need checking at the time of the calculation.
Is payback the same as return on investment?
No. Payback counts only the years needed to recover the cost. Return on investment compares the whole stream of savings with the alternatives for the same money, which the Department of Energy recommends doing alongside the payback figure.
How are loans and power purchase agreements treated?
With either arrangement a household may see savings on its bill immediately, so the break-even idea shifts from recovering an upfront cost to comparing monthly payments with monthly savings.